thread starvation
While running several benchmarks I saw that http_load was getting time outs for some of the connections. This has been seen with all web-servers and different backends in lighttpd as well.
After patching http_load to handle timed out and byte count errors correctly, I could easily separate the time outs from other problems. In one of the last changesets I added a infrastructure to track the time spent in lighttpd for a single connection including the time spent in the different stages of the gthread-aio backend:
- scheduling the threaded-read()
- starting the read() in the thread
- waiting until it is finish
- sending the result into the main-loop
- writing the buffered data to the socket
You can enable this timing by setting the define LOG_TIMING.
network_gthread_aio.c.78: (trace) write-start: 1173101341.237616 read-queue-wait: 680 ms read-time: 0 ms write-time: 21 ms
network_gthread_aio.c.78: (trace) write-start: 1173101341.229014 read-queue-wait: 576 ms read-time: 0 ms write-time: 134 ms
network_gthread_aio.c.78: (trace) write-start: 1173101341.240815 read-queue-wait: 681 ms read-time: 6 ms write-time: 19 ms
I wrote a script to extract this timing data from errorlog and used gnuplot to turn it to a images:
#!/bin/sh

## parse the errorlog for the lines from the timing_print
## - extract the numbers
## - sort it by start-time
## - make all timestamps relative to the first start-time

cat benchmark.error.log | \
    grep "network_gthread_aio.c.78:" | \
    awk '{ print $4,$6,$9,$12 }'  | \
    sort -n | \
    perl -ne '@e=split / /;if (!$start) { $start = $e[0]; } $e[0] = $e[0] - $start; print join " ", @e; ' > $1.data

cat <<EOF
set autoscale
set terminal png
set xlabel "start-time of a request"
set ylabel "ms per request"
set yrange [0:30000]

set title "$1"
set output "$1.png"
plot \
"$1.data" using 1:2 title "read-queue-wait-time" with points ps 0.2, \
"$1.data" using 1:(\$2 + \$3) title "read-time" with points ps 0.2, \
"$1.data" using 1:(\$2 + \$3 + \$4) title "write-time" with dots

set title "$1 (read-queue-wait)"
set output "$1-read-queue-wait.png"
plot \
"$1.data" using 1:2 title "read-queue-wait-time" with points ps 0.8

set title "$1 (read)"
set output "$1-read.png"
plot \
"$1.data" using 1:3 title "read-time" with points ps 0.8 pt 2

set title "$1 (write)"
set output "$1-write.png"
plot \
"$1.data" using 1:4 title "write-wait-time" with points ps 0.8 pt 3

EOF
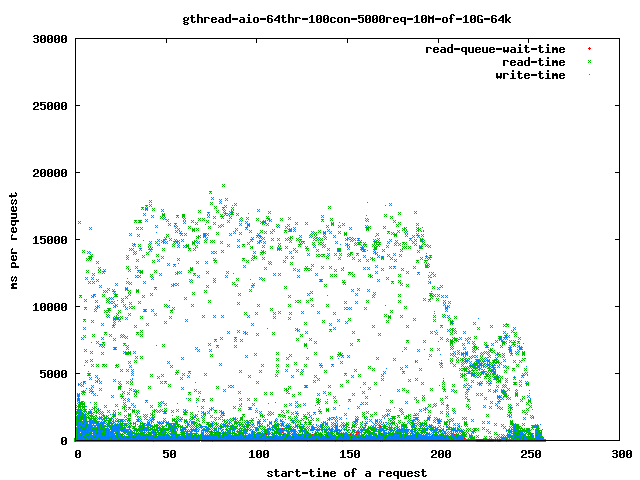
The first benchmark was taking:
and
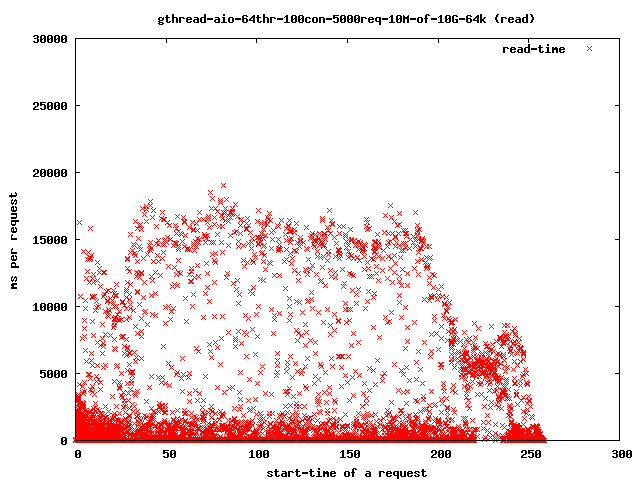
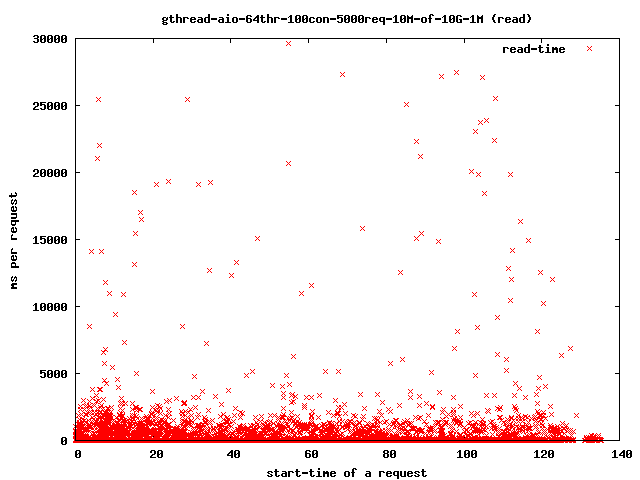
The time spent with read()ing the data from the disk goes up:
more detailed:
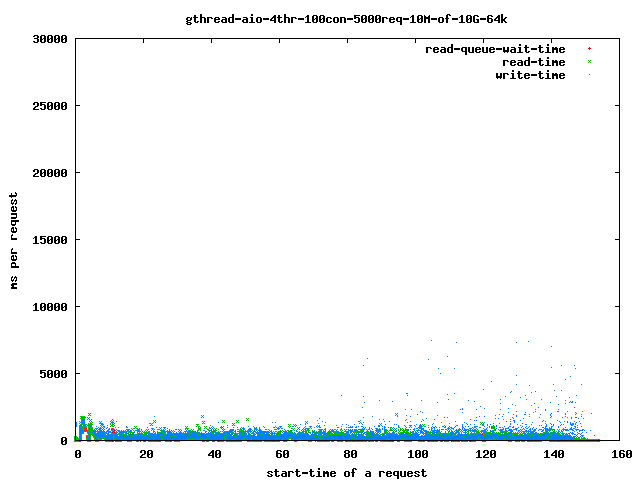
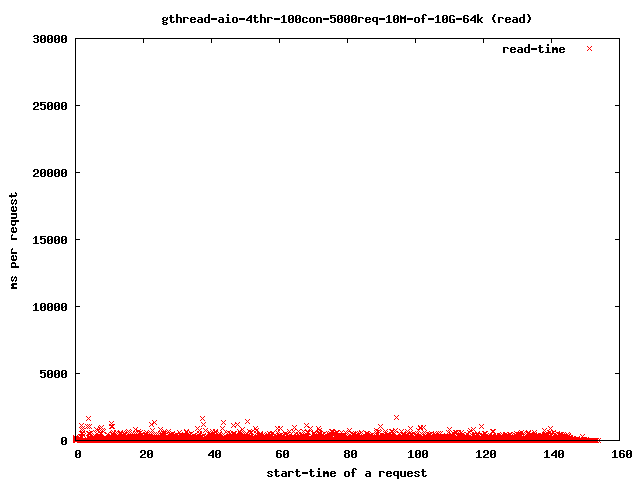
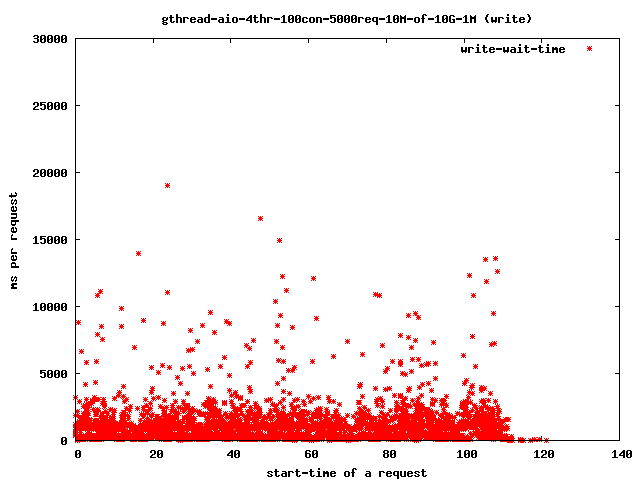
If you reduce the threads to 4 you get:
and the read-time drops to:
Interesting for our time-outs are only the dots which leave the 4 sec range as that are our starving read() threads. If it takes too long for them to finish the client will close the connection and the user will get a broken transfer.
Reducing the number of threads helps to limit the impact of the problem as we can see above in the graphs:
The probability of a stuck thread to get CPU-time again is increasing the more threads are getting stuck as less threads can run. In the worst case all available threads are waiting and at least one of them will get finished.
more graphs
-
4 read-threads, 10MByte files, 64kbytes read-ahead
all
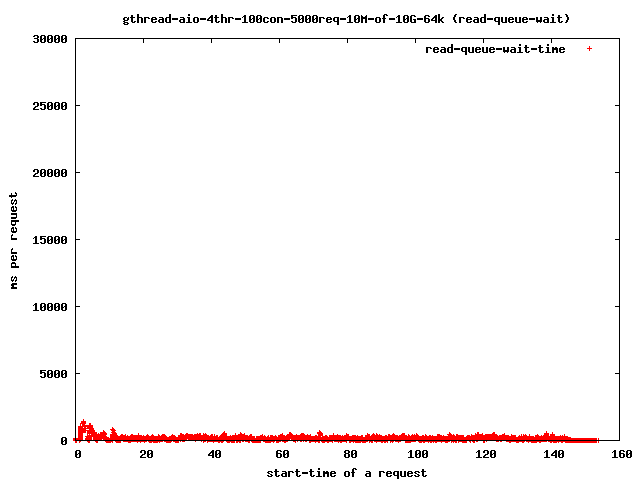
read-queue-wait
-
4 read-threads, 10MByte files, 1MBytes read-ahead
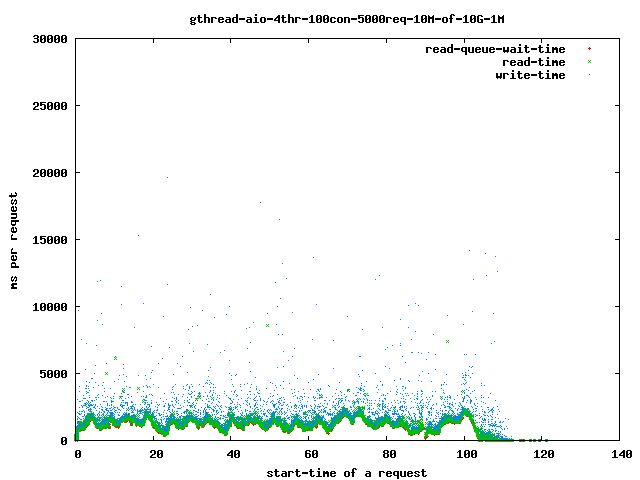
all
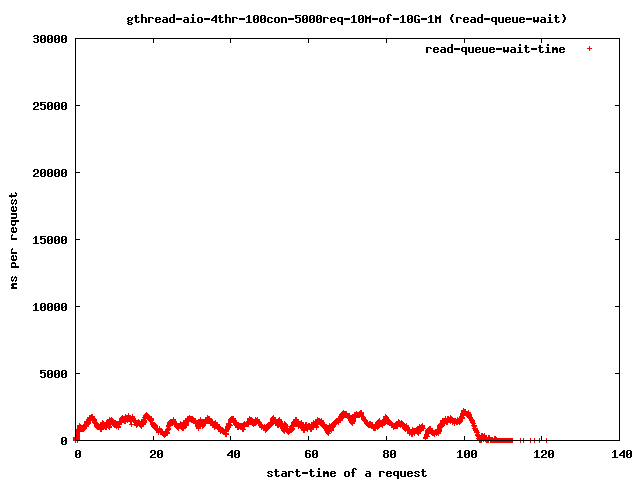
read-queue-wait
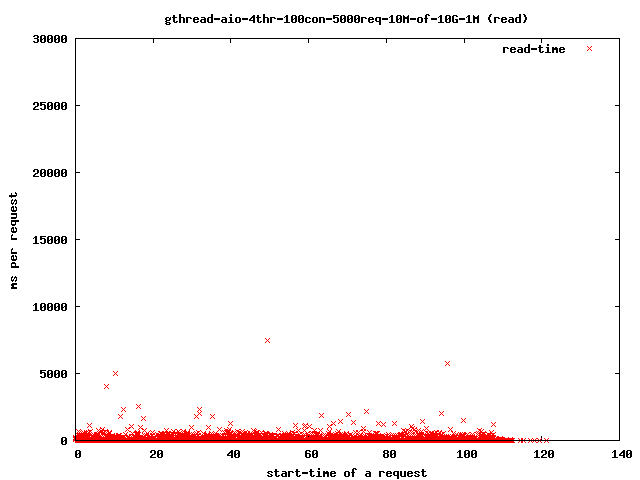
read
write
-
64 read-threads, 10MByte files, 64kbytes read-ahead
all
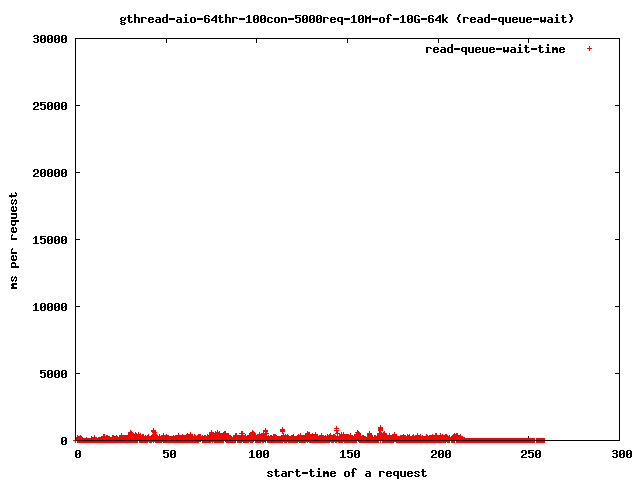
read-queue-wait
read
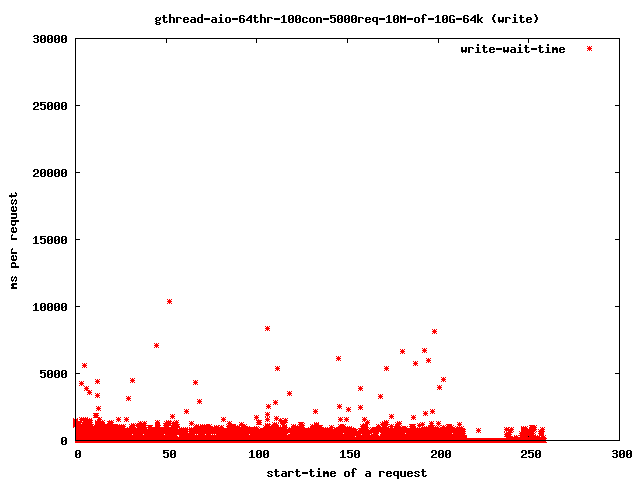
write
-
64 read-threads, 10MByte files, 1MBytes read-ahead
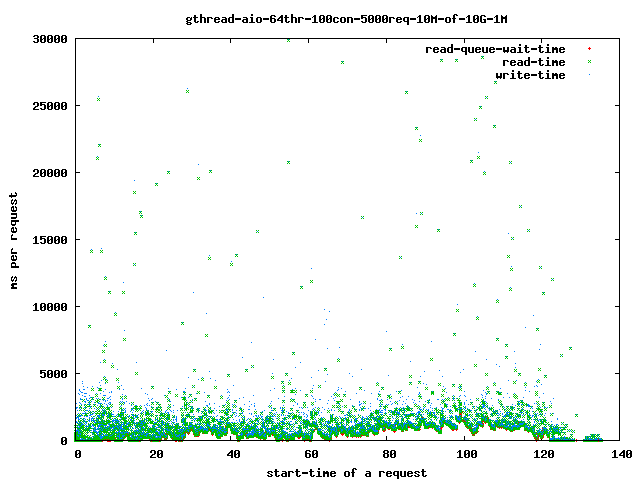
all
read
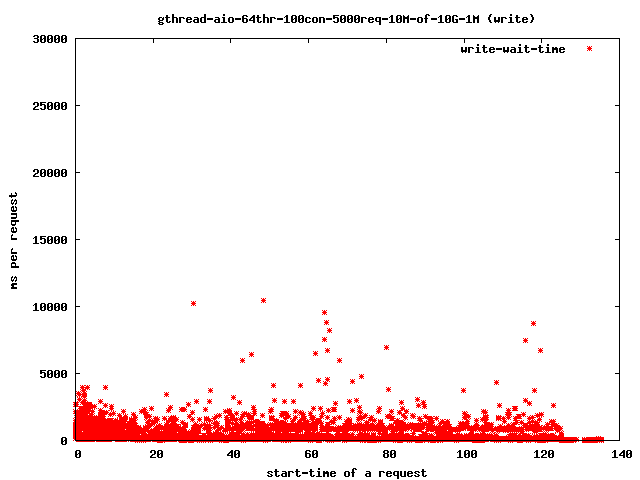
write
Rule of thumb
Keep max-threads at twice the number of disk.